“It is necessary, therefore, for that which moves itself to have a part that causes motion but is unmoved and a part that is moved but does not necessarily cause motion” – Aristotle
Research
Neuronal Correlates of Movement and Cognition
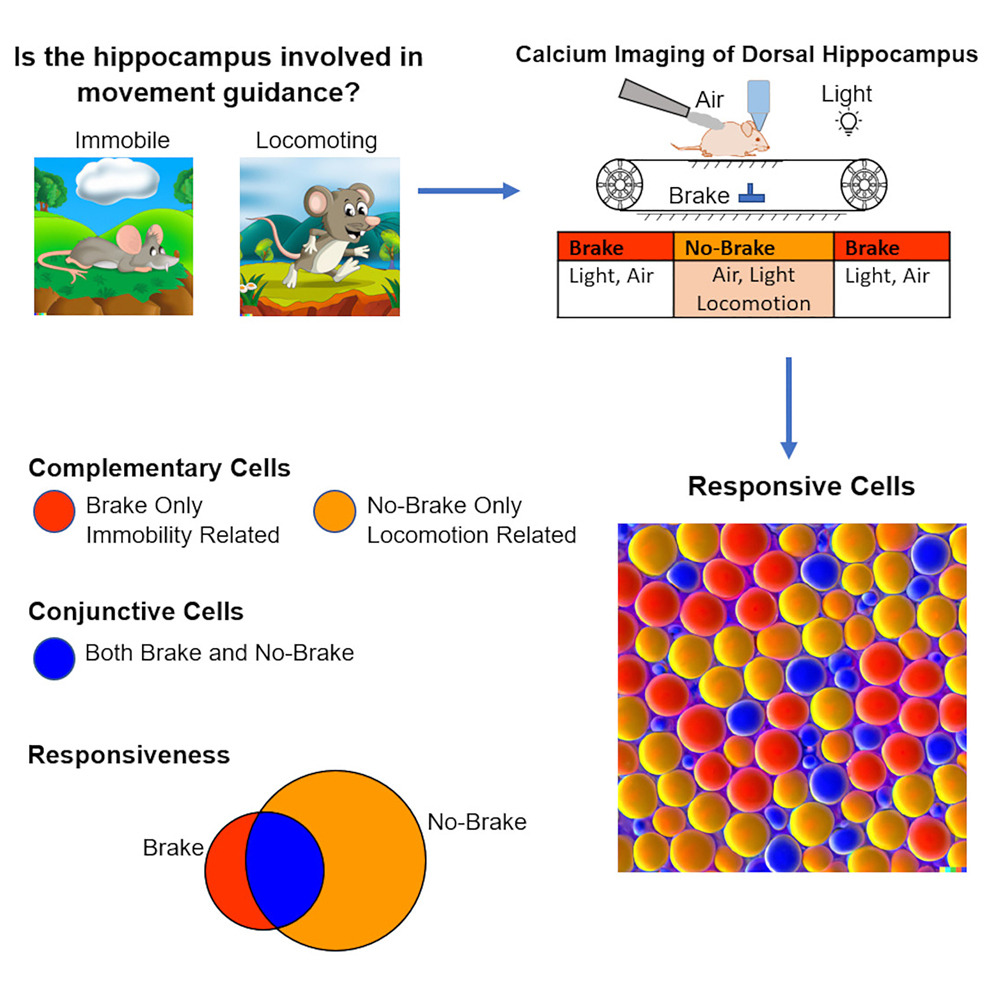
Role of Hippocampus in Movement Guidance(studied with 2P Calcium Imaging and Novel Behavior)
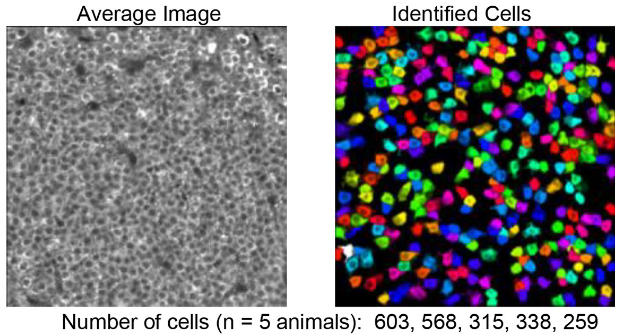
Average image (left) of the calcium imaging time series from a Thy1-GCaMP6s Mouse, and arbitrarily color-coded regions of interest indicating identified cell bodies (right) in a ∼400 × 400 μm imaging window.
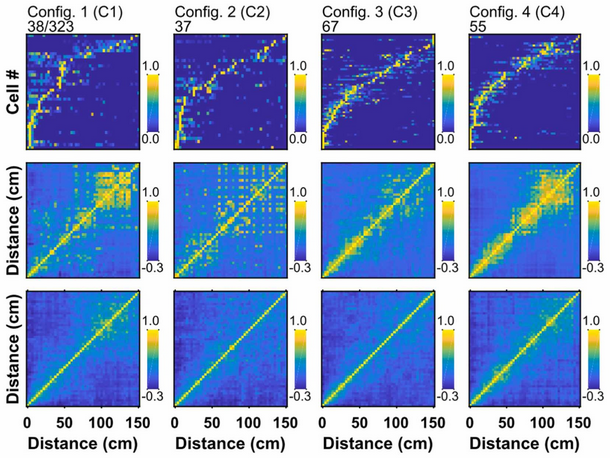
Distance and Time Encoding in Hippocampal CA1 Pyramidal Neurons
Rate vector maps (top row) showing neuronal response as a function of distance traveled from the air stream onset, averaged across trials (normalized by peak response), for all responsive neurons from a Thy1-GCaMP6s mouse for 4 different configurations, C1–C4. Population vector correlation plots (middle row), in which each pixel represents the Pearson correlation coefficient of 2 columns (bins) in the rate vector map. The glow around the diagonal indicates spatially-localized transient firing of neurons. Average population vector correlation plots (bottom row) for the entire group of 5 mice.
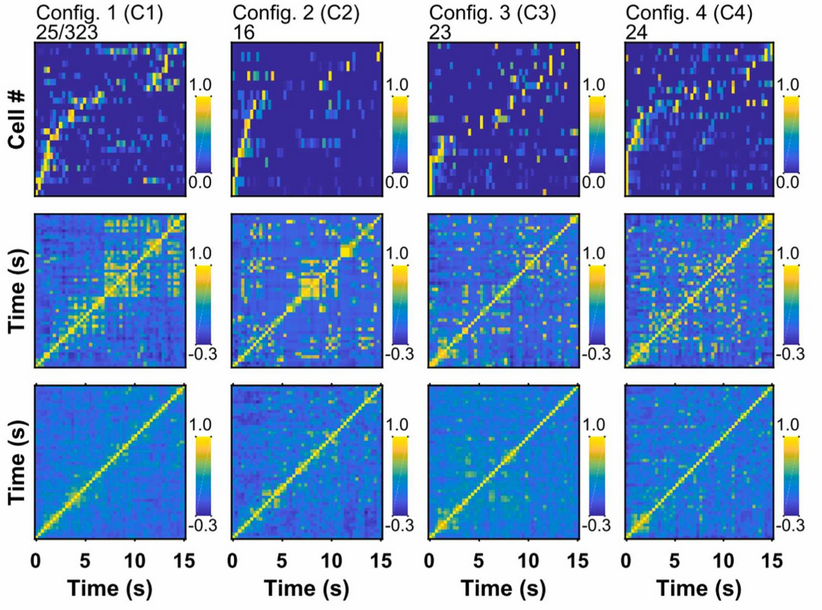
Rate vector maps (top row) showing neuronal response as a function of time elapsed from the air stream offset, averaged across trials (normalized by peak response), for all responsive neurons from a Thy1-GCaMP6s mouse for 4 different configurations, C1–C4. Population vector correlation plots (middle row), in which each pixel represents the Pearson correlation coefficient of 2 columns (bins) in the rate vector map. The glow around the diagonal indicates temporally-localized transient firing of neurons. Average population vector correlation plots (bottom row) for the entire group of 5 mice.
Development of Novel Behavioral Setups for Studying Movement
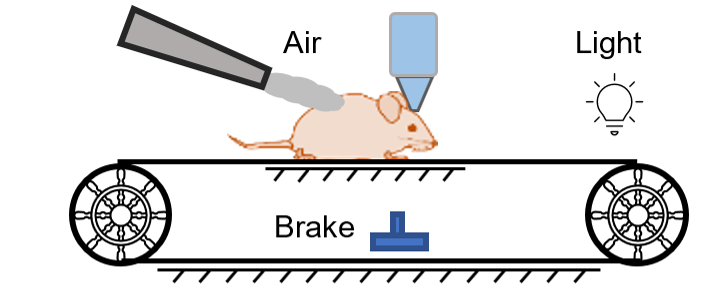
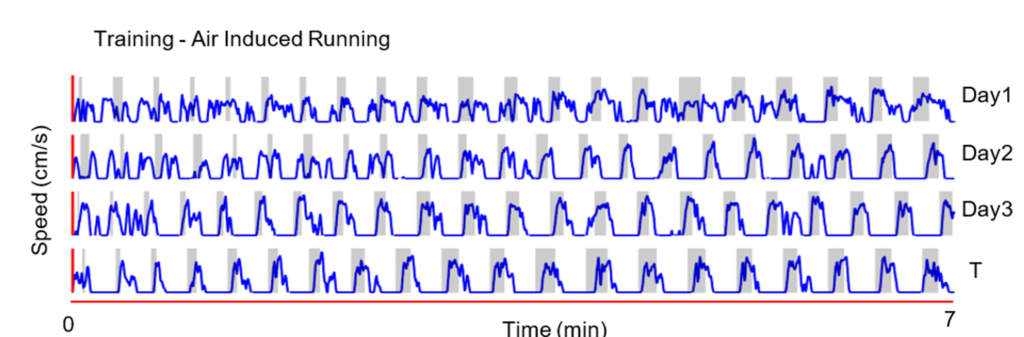
The Air Induced Running Task
Mouse running speed vs Time for Training Days 1, 2, and 3, and Testing Day (T). Gray shaded regions indicate applications of air stream
Development of Computational Methods for the Analysis of Movement
Whole Body and Pose Estimation Analysis for the String Pulling Task (Download the Matlab Toolbox from GitHub)
Representative bout of string pulling sequence of a mouse and examples of a subset of analysis. From left to right, 1) tracked hands, ears, nose, and body of the mouse, 2) path of hands, 3) instantaneous speed determined using optical flow, and 4) and 5) show running standard deviation and average of the image sequence respectively
Development of Computational Tools for Wide-Field Brain Imaging Data
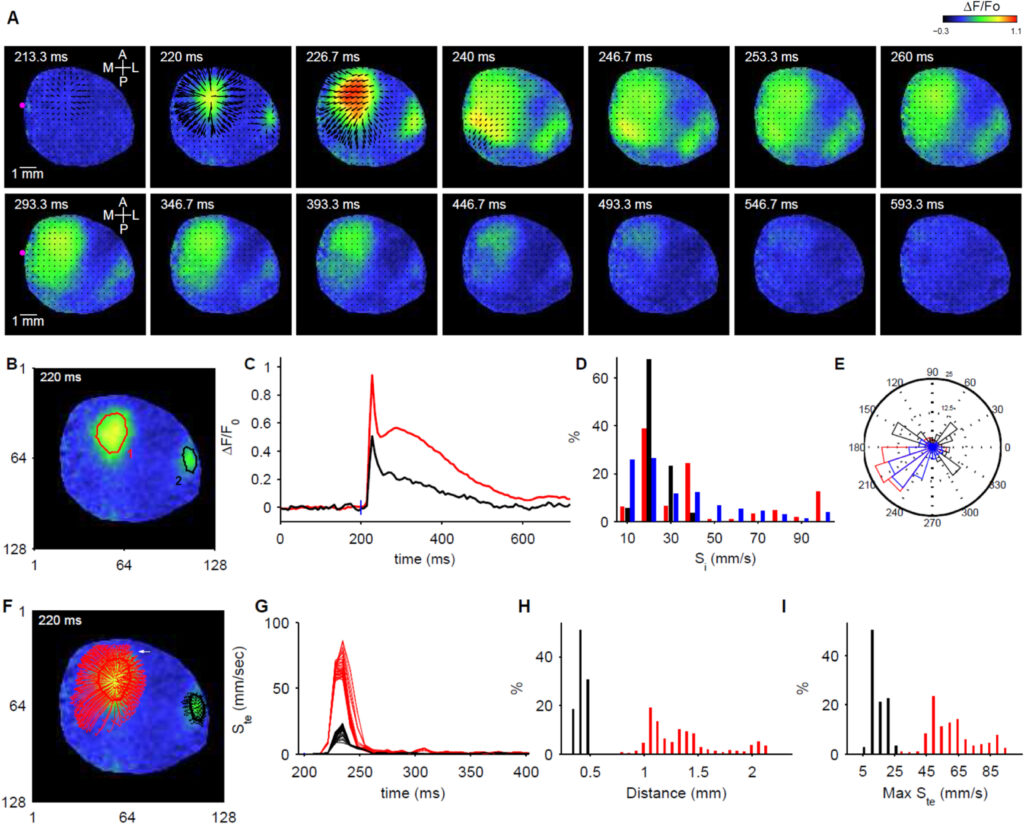
Mesoscale Voltage-Sensitive Dye (VSD) and Calcium Imaging Analysis – Traveling Waves (Download the Matlab Toolbox from GitHub)
Optical flow characterization of forelimb stimulation-evoked VSD activation in anesthetized mouse. A. Montage of selected frames from the image sequence with overlaid velocity vector fields. Magenta dot in the first (top left) frame indicates bregma location. B. Regions of interest (ROIs) on the primary (red) and secondary (black) forelimb areas. C. ΔF/Fo vs time for ROIs in (B). D. Distribution of instantaneous speeds taken across all image frames of pixels in the ROIs in B (same colors) and for pixels within the mask (blue bars). E. Similar to (D) but distribution of instantaneous angles taken across all image frames of pixels within ROIs and the mask. F. Trajectories of pixels (shown only for some pixels) in ROIs from (B) – same colors as in (B). G. Estimated temporal speeds of all pixels in the ROIs. H. Distribution of lengths of trajectories. I. Distribution of maximum of temporal speeds. Blue lines (at 200 ms) in C and G indicate the stimulus onset.